Lessons from incarceration: why are significantly fewer children dying than usual?
By Mark Blaxill and Amy Becker, June 18, 2020.
Originally posted by Health Choice[1] as the White Paper
 COVID-19 is a serious public health topic, but we can hardly find out about the true nature of this virus from the terrifying media reports about the number of infected and dead, as well as from the unprecedented measures that have been imposed to prevent infection. As in many other complex and pervasive health phenomena, there are many ways to assess the effects on human health, but in our view this assessment cannot be made only on the basis of some small or mediocre set of parameters, but should look at the overall health achievements as a whole. In the case of a pandemic virus that affects a large population and where we are concerned about a sudden increase in the number of deaths, the best estimate is not based on the number of deaths more or less related to the viral disease, but instead looking at the deaths in which the death occurred due to all causes. For comparative purposes, these deaths must be compared with all-cause mortality rates in previous years (percentage of expected death). As we will show, a balanced view of the broader American experience with the coronavirus shows both the extent and variability of its negative outcomes among older Americans, especially the elderly, but also some unexpected positive results. Surprisingly, death rates for younger people in the US have decreased during the lockdown, especially for infants. These trends have largely gone unnoticed and remain so so far unexplained. All-cause mortality rates vary widely, and this is somewhat predictable. The most pronounced variations occur by age group (most deaths occur in older people), with variations depending on the season and, to a lesser extent, according to
  geographical location. Deaths from all causes are cyclical, typically increasing statistically in the winter months and flu season, then decreasing to lower levels as warmer weather approaches. The fact is that the death rate differs depending on the region - this is mainly due to differences in the age distribution of the population. In the case of the corona virus, death rates do not yet appear to be cyclical, but vary considerably by age and geographic location. In the analysis that follows, we examined indicators of the overall mortality rate by geographic location (mainly by country), by age group, and by week (and flu season). We have singled out eight main "lessons". Some of them are part of current discussions about the corona virus; others are unexpected or at least not common. Where does this difference come from? Since the "scientific elite" produces "pandemic stories", the evidence we have deviates from the official versions mainly due to long-standing prejudices and wrong patterns that have become established among experts in that community.
Overall American trend
 The impact of the corona virus on deaths from all causes is clearly visible. In a short period, tens of thousands more Americans died than expected[2]. Before mid-March, the total number of deaths in the US was at a level that did not differ from previous years: between 55 and 60 thousand per week. Beginning sometime around the end of March, all-cause mortality began to rise sharply, peaking in the week ending April 11 at about 75,000, or 137% expected deaths for the week. Immediately after that, mortality from all causes began to drop sharply. Within five weeks, overall mortality returned to its usual values. By mid-May, the measurable impact of mortality from the pandemic ended, although there were still deaths due to the virus[3]. The corona virus (COVID-19) as a cause of death is not always clear, due to the significant overlap between COVID-19, pneumonia, influenza and, probably, other primary causes3.Thus, the jump in the number of deaths officially attributed to COVID-19 occurred together with the jump in
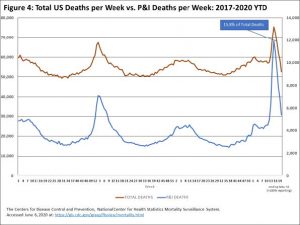 the number of deaths from all causes, so we can say with high probability that COVID-19 made the main contribution to the excess of expected deaths between March 22 and May 9. At least in that 8-week period, the corona-virus pandemic was significantly worse than the typical seasonal flu. To the extent that all-cause deaths declined to expected levels during May, excess deaths attributable to the pandemic passed2.
Localization
Increased all-cause mortality rates during the pandemic are highly localized, and vary widely 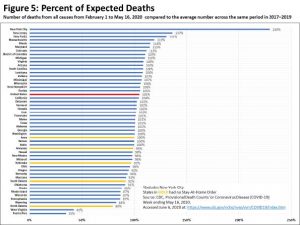 depending on the federal state, i.e. jurisdiction. For the 3 1/2 month period during the pandemic, starting from February 1 to May 16 (the most recent period with 100% reporting), total deaths in the US came in at 1,05% more than expected3.Many states during this period actually had lower mortality than expected. To be sure, the excess death rate from 5% across the US is substantial, but also far less than the apocalyptic scenarios that have been heralded.
The higher-than-expected death rates were highly concentrated in the northeastern US: New York City and its environs, including New Jersey, New York State, Connecticut, Massachusetts, Maryland and the District of Columbia, so far accounted for six of the 8 jurisdictions with the highest excessive mortality. New York City was hit particularly hard. In a typical spring, New York City could expect about 700 to 800 deaths per week from all causes. From mid-March to mid-May, that number skyrocketed, tenfold, peaking at over 7,500 deaths a week.  which ended on April 112.Other northeastern states also saw a sharp increase in the expected number of deaths, but nowhere near New York's rate3. The timing of the peaks varied, with Massachusetts coming in the fastest, followed by Maryland, New York City, and New Jersey. Nonetheless, the region as a whole saw a decline in expected deaths starting in May. Many states had no or small increases in expected deaths, including some of the largest states, such as California, Florida and Texas3. This suggests that there may have been certain factors that made New York specific compared to other areas.
Variations due to different health policy
To the extent that the policy varied across states, it is not clear whether more or less strict confinement had anything to do with variations in excess mortality. Less severe incarceration was not associated with higher mortality rates. In fact, the five states that chose not to impose lockdowns are among the roughly 20 areas without any excess mortality3.In several states with the most aggressive closures, including California, Maine, Minnesota, and Pennsylvania, saw almost no effect on excess mortality. Despite its huge population centers, California was nothing like the city of New York and its state of the same name. One of the strictest policies was imposed by the largely rural state of Maine, for no apparent reason. Minnesota followed a far more aggressive policy of closure than neighboring states Iowa, South and North Dakota, and Wisconsin. Still, the death rate from the coronavirus was among the highest in the country: About 80% of those who died in Minnesota were frail elderly people cared for in long-term care facilities3.
Have aggressive policies prevented the worst-case scenario and helped keep vulnerable states from becoming disaster areas like New York City? No controlled experiment will give us the answer to that. Pennsylvania best exemplifies this, with early excess mortality similar to its northeastern neighbors, but this mortality has declined sharply by early April. But Pennsylvania is also an unusual geographical entity, with the largest city, Philadelphia, lying on the coast and separated from the western part of the state and the second largest city, Pittsburgh, by the Appalachian Mountains. This oddity makes it difficult for us to draw clear conclusions from the curve of the coronavirus in Pennsylvania.
The effect of age
It is a generally accepted fact that during the corona virus pandemic, the risk of death is the highest among the elderly. All-cause mortality shows this clearly, with a large increase in deaths among those aged 65 and over: the increase began in late March, peaked in early April, and then turned sharply downward in May, so that the rate of excess mortality almost disappeared by the end of that month2. The tens of thousands of excess deaths in this older age group contributed in large part to the total number of excess deaths in the US.
Adults between the ages of 18 and 64 show a similar pattern of excess mortality as older adults, although the total number of deaths was lower in that age group2.
With a dataset that provides more detailed age groups, the impact is even clearer: the older the age group, the higher the total number of deaths during the pandemic[4]. The largest number of deaths, as well as the increase in the number of deaths, occurs in people over 85 years old, followed by people aged 75 to 84, then the age group of 65 to 74 years. There is only one other group where mortality increased during the pandemic: it was the 55-64 age group, with a small increase in the number of deaths during April. For all age groups under 55, the impact of this pandemic was not statistically observed.
Most observers believe they understand this age effect and ignore it. The fact that older people die more often is not a reason not to protect them from the pandemic. But as we have focused on incarceration as a means to protect older people from tragic and premature loss of life, we have missed an entirely unintended but beneficial effect of incarceration: the inexplicable collapse of excess mortality among the young, especially children and infants.
The effect of age in children
 Mortality among children under the age of 18 is relatively rare and shows patterns that differ from those of the elderly. The pronounced cyclical effect in all-cause mortality that we have in adults is completely absent in children. And while weekly mortality among adults dominates the total number of deaths in the U.S.—about 13,000 deaths among ages 18 to 64 and 35,000 to 40,000 deaths per week among ages 65 and older—weekly mortality among children varies. by country and on average it is about 700. More than half of that number occurs in infants younger than 1 year.
However, the pandemic experience surprised us with an unexpected reduced death rate among children. Beginning in early March, the number of expected deaths fell sharply, from an expected level of about 700 deaths per week to well below 500 by mid-April and throughout May2.While premature deaths were rampant among the elderly in nursing homes in Manhattan and in similar settings around the country, something was secretly saving the lives of children. While spring is during the general closures in America brought massive disruption to family life, miraculously approximately 30% fewer children died!?!Was it a protective effect of closed schools? Did teenagers expose themselves to risky situations to a lesser extent? Not. The effect was only insignificant among school children or adolescents of school age4.Almost all of the change in mortality comes from newborns. For some reason, the changed pattern of American life during confinement saved the lives of hundreds of newborns, an average of more than 200 per week. Infant and child deaths occur to a greater extent in minority groups[5]. Thus, reduced child mortality during incarceration meant that the lives of little black children, as well as Hispanic infants and children, were saved at a higher percentage.
Net effect in life years
 Every premature death is tragic. But if we think about it, the premature death of a newborn has more serious consequences than the premature death of someone whose life expectancy is 5 years or less. And while in Minnesota, the average age of those who died from the corona virus is, say, 83 years, the average life expectancy of the elderly population that was not infected with the virus could be only 2 to 3 years more. In comparison, when a newborn in a closed situation avoids death, the possible life expectancy of that child can increase to 80 years or more[6]. When measuring the net effect of life years: either lost or gained during the pandemic and related blockades, it is unexpectedly mixed net result by age group. Not surprisingly, excess mortality is highest in the elderly, where life expectancy is lowest. Combining excess deaths with life expectancy by age group (adjusting for the quality of those life years) shows the 'cost' of the pandemic: about 540,000 life years lost among those 65 and older4, 6, [7]. By comparison, the reduction in expected death is greatest in infants, where the benefits of future lifespan are greatest. Compared to expectations, the lives of over 200 newborns per week were saved during May. Combining the number of lives saved for newborns and children aged 1 to 4 years shows a smaller but comparably large and beneficial effect: approximately 145,000 life years were saved among children under 5 years of age. Of course, with a note that the surprisingly positive effect of confinement on newborns and young children does not negate the tragic effect of the pandemic on the elderly. However, the puzzle remains: why are so few children dying?
Causality?
 When an infant dies, it is often due to some form of congenital condition or birth defect. Unfortunately, accidents and murders are also common causes. However, there are frequent cases in which previously healthy infants die unexpectedly. These deaths are usually classified as “sudden infant death syndrome” or SIDS. According to the CDC (Center for Disease Control and Prevention), SIDS mortality is one of the two leading causes of death among newborns between the ages of 1 month and 1 year[8].
We do not have concrete data on the trend of SIDS deaths during the pandemic. We have heard, however, anecdotal reports from emergency room doctors suggesting that some have noticed that SIDS has been on the decline. One group of doctors who might see 3 cases of SIDS in a typical week have not seen a single case since the pandemic and its associated lockdowns began.
What has changed in that period to be able to have such an effect? Are infant deaths not properly recorded? Do parents take better care of their families when they work remotely and their children are out of school? There are many possible hypotheses about the decline in infant mortality.
The public heard the news that public health officials regret the sharp drop in the number of vaccinated newborns, because parents do not take their children to pediatric surgeries for regular examinations. In the CDC's May 15 Morbidity and Mortality Weekly Report (MMWR), a group of authors from the CDC and Kaiser Permanente reported a sharp drop in orders for vaccine providers, as well as a reduced color of administered doses of pediatric vaccines[9]. That decline began in early March, around the time when infant mortality began to decline.
This effect may not be limited to the US. The World Health Organization issued a press release on May 22, noting that "as of March 2020, routine childhood immunization activities have been disrupted globally, which may be unprecedented since the inception of Expanded Programs on Immunization (EPI) in the 1970s." [10] Are fewer children dying because parents are skipping routine childhood vaccines? If lives were saved during the pandemic, that is a fact we should all think about.
COVID-19 is unique among recent pandemics in that the death toll is measurable, real, and believable. It is almost certain that it is fleeting, but that will not stop the propaganda machine from its campaign. However, as they say: "Even the best laid plans of mice and men often go awry".
What no one would have predicted about this virus is that extreme confinement has produced a natural experiment that actually makes the action itself questionable - widespread, mandatory vaccination for all - which the public health community, which has been fighting infectious diseases in this sense for years, has been pushing for. they exert pressure. We should mourn the deaths of so many in Manhattan nursing homes, but also consider the hundreds of newborns who escaped death. Only with such a balance will we draw appropriate lessons from the pandemic and the confinement that followed due to the corona virus.
[1] https://healthchoice.org/
[2] The Centers for Disease Control and Prevention. National Center for Health Statistics Mortality Surveillance System. [Online] [Cited: June 6, 2020] https://gis.cdc.gov/grasp/fluview/mortality.html.
[3] —. Provisional Death Counts for Coronavirus Disease (COVID‐19). [Online] [Cited: June 6, 2020.] https://www.cdc.gov/nchs/nvss/vsrr/COVID19/index.htm.
[4] —. Provisional COVID‐19 Death Counts by Sex, Age, and Week. [Online] [Cited: June 6, 2020.] https://data.cdc.gov/NCHS/Provisional‐COVID‐19‐Death‐Counts‐by‐Sex‐Age‐and‐W/vsak‐wrfu.
[5] __. Deaths involving coronavirus disease 2019 (COVID‐19) by race and Hispanic origin group and age, by state. [Online] [Cited: June 6, 2020.] https://data.cdc.gov/NCHS/Deaths‐involving‐coronavirus‐disease‐2019‐COVID‐19/ks3g‐spdg.
[6] Social Security Administration. Actuarial Life Table. [Online] [Cited: June 7, 2020] https://www.ssa.gov/oact/STATS/table4c6.html.
[7] The Centers for Disease Control and Prevention. Weekly counts of deaths by jurisdiction and age group. [Online] [Cited: June 7, 2020.] https://data.cdc.gov/NCHS/Weekly‐counts‐of‐deaths‐by‐jurisdiction‐and‐age‐gr/y5bj‐9g5w.
[8] —. NCHS Data Brief, Number 355. [Online] January 2020. [Cited: May 16, 2020.] https://www.cdc.gov/nchs/data/databriefs/db355_tables‐508.pdf#4.
[9] Santoli, Jeanne M et al. Effects of the COVID‐19 Pandemic on Routine Pediatric Vaccine Ordering and Administration — United States, 2020. cdc.gov. [Online] May 15, 2020.
https://www.cdc.gov/mmwr/volumes/69/wr/mm6919e2.htm#F1_down.
[10] World Health Organization. At least 80 million children under one are at risk of diseases such as diphtheria, measles and polio as COVID-19 disrupts routine vaccination efforts, warn Gavi, WHO and UNICEF. [Online] [Cited: May 23, 2020] https://www.who.int/news‐room/detail/22‐05‐2020‐at‐least‐80‐million‐children‐under‐one‐at‐ risk-of-diseases-such-as-diphtheria-measles-and-polio-as-covid-19-disrupts-routine-vaccination-efforts-warn-gavi-who-and-unicef.